You know, R is a very popular programming language for data analysis and statistical computing.
One of the key features of R that attracts the Data analysts and machine learning geeks is its vast collection of packages.
Packages are nothing but, collections of functions, data, and other objects.
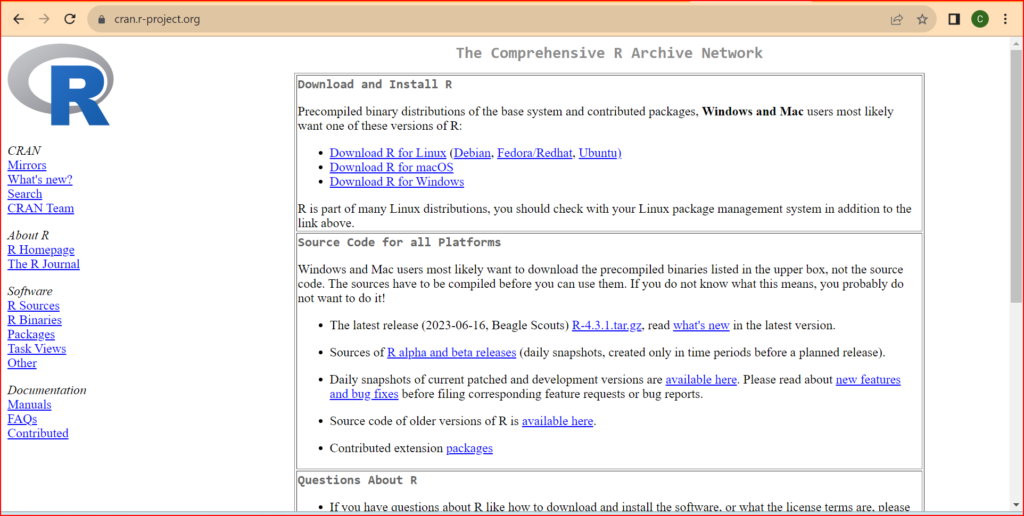
They are created and maintained by developers from around the world and are available for download from the Comprehensive R Archive Network (CRAN).
Well, you may ask
Why do we need Packages
Well, R itself has a rich set of built-in functions, which do not require installing any packages.
However, it can be limited when it comes to performing specialized tasks.
And that’s where the various packages come in.
For example, let’s say you want to create a data visualization.
R has some built-in functions for this task.
Some of these are:
plot(): for creating various types of plotshist(): for creating histogramsbarplot(): for creating bar chartsboxplot(): for creating box plotspie(): for creating pie chartsmean(): for calculating the mean of a vector of numberssd(): for calculating the standard deviation of a vector of numbersvar(): for calculating the variance of a vector of numberscor(): for calculating the correlation between two vectors of numberslm(): for fitting linear modelst.test(): for performing t-tests
These functions are part of the base R language.
You can use them without installing any additional packages.
But, what if you are interested in creating complex visualizations?!
Well, then it can sometimes take a hell lot of your time, if you restrict yourself to the above base functions only.
But, by using the ggplot2 package, you can create high-quality visualizations quickly and easily.
So, in a nutshell, by using packages, you can extend R’s capabilities to tackle a wide range of data analysis tasks.
How can you access these Packages
Well, you can access any of the thousands of packages available on the CRAN website https://cran.r-project.org/

There is another way also for accessing the above packages,
And that is, by directly accessing the link
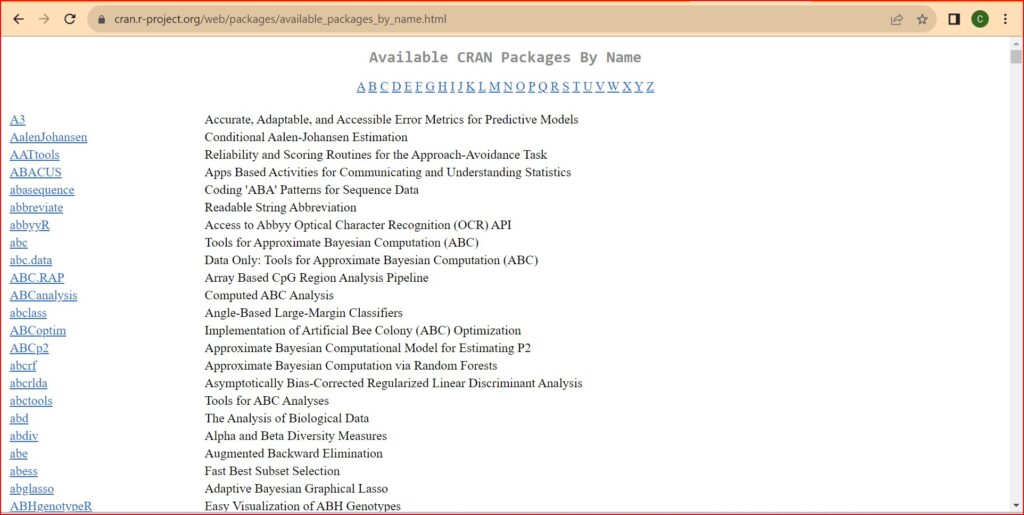
https://cran.r-project.org/web/packages/available_packages_by_name.html
Here’s a sample list of the various packages that you can use for your Data Analytics and ML requirements.

With the help of these packages, you can easily augment the functionality of R to tackle a wide range of data analysis tasks.
In this beginner’s guide, we will walk you through the process of installing and loading packages in R.
Installing Packages
To install a package in R, you can use the install.packages() function. For example, let’s say you want to install the ggplot2 package, which is a popular package for creating data visualizations.
You would run the following code in your R console:
install.packages("ggplot2")
This command will download the ggplot2 package from CRAN and install it on your system.
Remember, you only need to install a package once.
After that, you can load it whenever you need it.
Loading Packages
To use a package in R, you need to load it into your working environment.
This is done using the library() function.
For example, to load the ggplot2 package, you would run the following code:
library(ggplot2)
This command makes all the functions and data in the ggplot2 package available for use in your R code.
Conclusion
Installing and loading packages is an essential aspect of working with R.
With the vast collection of packages available, you can extend the capabilities of R to tackle a wide range of data analysis tasks.
By following this beginner’s guide, you should now have a good understanding of how to install and load packages in R.
We hope this guide helps you get started with working with packages in R.
Happy coding!
