by Chaitanya | Oct 31, 2024 | Data Analytics

If you’re new to the world of machine learning, you’ve probably come across terms like “Bagging” and “Boosting” quite often.
These techniques fall under the broader umbrella of ensemble methods.
Here, the goal is to enhance model performance.
This is achieved by combining multiple “weak learners” (models that perform slightly better than random guessing) into a “strong learner.”
But what exactly are Bagging and Boosting?
And how are they different?
Let’s break it down.
(more…)
by Chaitanya | Oct 20, 2024 | Data Analytics

Imagine this.
Your company just launched a new AI-powered loan approval system.
It’s faster, more efficient, and promises to reduce risk.
But then, reports start surfacing, “The system seems to be unfairly denying loans to people from certain regions (based on the zipcodes/pincodes)”
Panic sets in.
Is your AI biased?
How do you find out?
And more importantly, how do you fix it?
This scenario highlights a growing challenge in the world of AI: the need for explainability.
As AI systems become increasingly complex and integrated into critical business processes, understanding their inner workings is no longer a luxury, it’s a necessity.
Enter Explainable AI (XAI), your AI detective, here to shed light on those “black box” algorithms and help you understand the “why” behind the “what”. (more…)
by Chaitanya | Oct 6, 2024 | Data Analytics

Ever wondered why some data points in your dataset just don’t fit in?
Maybe you’re analyzing transactions, and a few seem suspiciously higher than the rest.
Or perhaps you’re looking at sensor data, and suddenly there’s a spike that doesn’t make sense.
These are outliers—data points that stand out from the norm—and detecting them is super important for things like fraud detection, security, and even ensuring the quality of products in manufacturing.
Now, if you’ve worked with basic methods like z-scores or the interquartile range (IQR), you probably know they do a decent job when the dataset is small or simple.
But when it comes to large, complex, or high-dimensional datasets, those traditional approaches can start to fall short.
That’s where the Isolation Forest algorithm steps in as a game changer. (more…)
by Chaitanya | Sep 28, 2024 | Data Analytics

Let’s face it – time series forecasting can be a bit of a puzzle.
One minute you’re dealing with trends, the next you’re battling seasonality.
And let’s not even get started on those pesky external factors that seem to pop up out of nowhere. It’s enough to make your head spin!
The biggest challenge? Creating a model that can keep up with the ever-changing dynamics of your data.
But fear not, there’s a solution!
Say hello to the Walk Forward Method, your new best friend in the world of time series forecasting. (more…)
by Chaitanya | Sep 22, 2024 | Data Analytics

Dimensionality reduction might sound technical, but it’s an essential technique that helps researchers and data scientists to distill large and complex datasets into simpler, more understandable forms.
One of the most well-known methods for this is Principal Component Analysis (PCA).
In this blog, we’ll explore how PCA is revolutionizing fields like medical imaging, genomics, and beyond.
(more…)
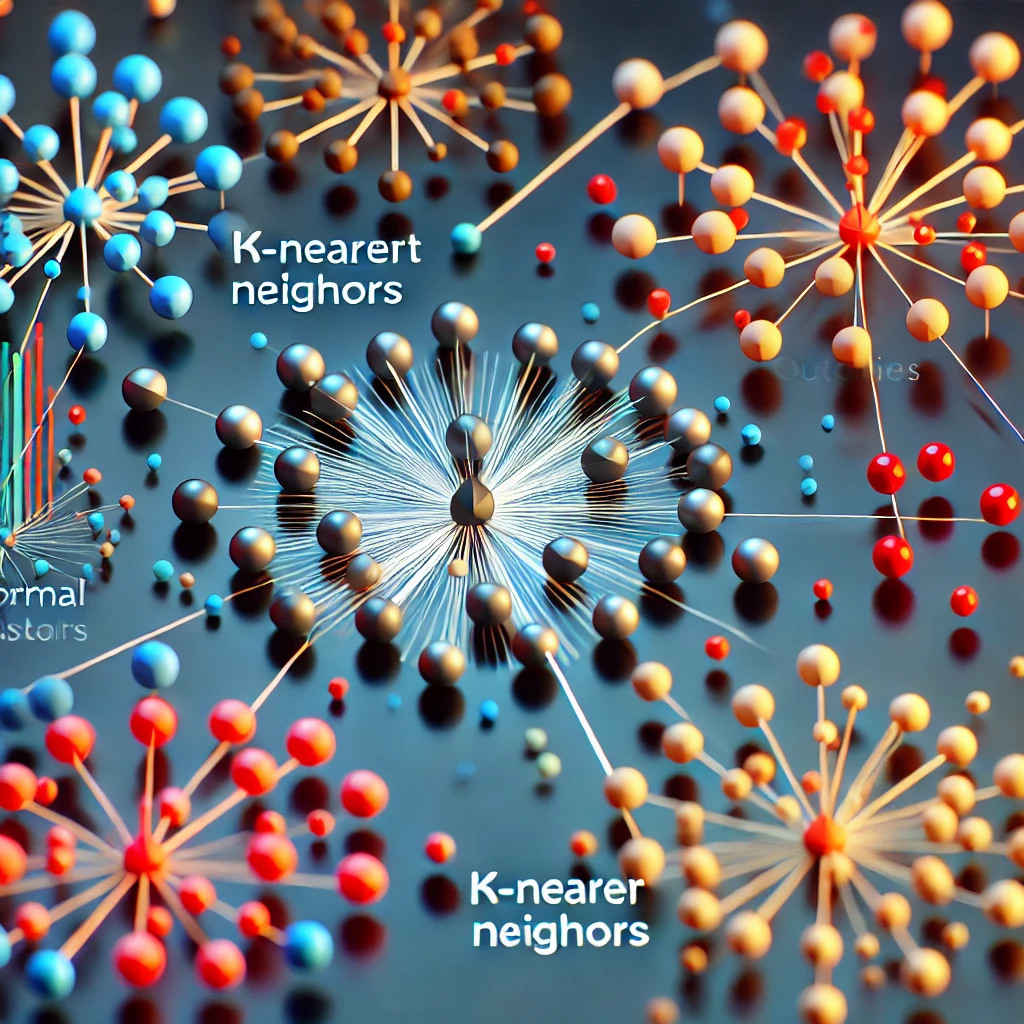
by Chaitanya | Sep 9, 2024 | Data Analytics

Introduction
In today’s data-driven world, anomalies – those unusual data points that deviate significantly from the norm – can be indicators of fraud, system failures, or even groundbreaking discoveries.
But how can we effectively identify these anomalies amidst massive datasets?
Enter the k-Nearest Neighbors (KNN) algorithm, a versatile tool that’s gaining traction in the field of anomaly detection.
(more…)


