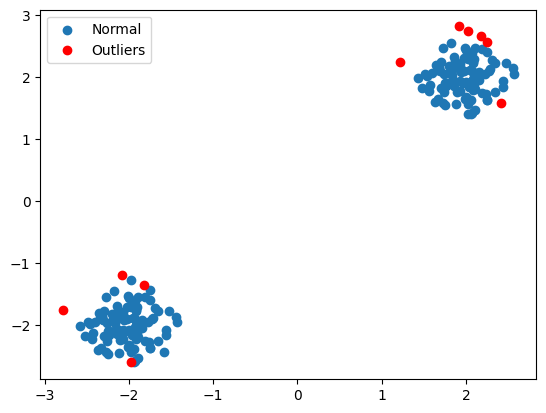
Ever wondered why some data points in your dataset just don’t fit in?

Maybe you’re analyzing transactions, and a few seem suspiciously higher than the rest.

Or perhaps you’re looking at sensor data, and suddenly there’s a spike that doesn’t make sense.

These are outliers—data points that stand out from the norm—and detecting them is super important for things like fraud detection, security, and even ensuring the quality of products in manufacturing.

Now, if you’ve worked with basic methods like z-scores or the interquartile range (IQR), you probably know they do a decent job when the dataset is small or simple.

But when it comes to large, complex, or high-dimensional datasets, those traditional approaches can start to fall short.

That’s where the Isolation Forest algorithm steps in as a game changer.


Isolation Forest is a unique, unsupervised machine-learning algorithm specifically designed for outlier detection.

Instead of trying to calculate how far or different a point is from the rest (like other methods), it works by randomly splitting the data into smaller chunks.

Outliers, being “few and different,” tend to be isolated faster than the normal data, making it a smart and efficient way to detect anomalies, even in large datasets.

In this post, we’ll break down how Isolation Forest works, why it’s such a good fit for outlier detection, and how you can implement it in your own projects using Python. Let’s dive in!


What is Outlier Detection?


Outlier detection might sound technical, but it’s really just about finding data points that don’t fit in with the rest.

Think of it like being at a party where everyone is dressed casually, but one person shows up in a tuxedo. That person stands out, just like an outlier in a dataset.


But why does this matter?


In many real-world scenarios, outliers can signal something important.

For example, an unusually high transaction could be a sign of fraud, or a sudden change in temperature data from a sensor could point to a malfunction.

Detecting these outliers helps us catch unusual behavior before it leads to bigger problems.

Outliers come in different forms, too.

Sometimes, a single data point is off. It is called a univariate outlier.

Other times, it’s not just one variable but a combination of variables that doesn’t match the expected pattern—this is a multivariate outlier.

Then, there are collective outliers, which are groups of points that, on their own, seem normal, but together they form an unusual pattern.

The challenge with outliers is that they can be tricky to spot, especially in big, complex datasets.

That’s why we need more advanced methods, like Isolation Forest, to make the job easier.


Introduction to Isolation Forest


So, what’s Isolation Forest all about?

In simple terms, it’s an algorithm that’s really good at finding outliers by doing something different than most traditional methods.

Here’s how it works:

Instead of measuring how far a point is from others or calculating density, Isolation Forest focuses on how quickly a data point can be isolated.

The idea is that outliers are “few and different,” so it’s easier to isolate them compared to normal data points.

Imagine chopping up a dataset into smaller pieces.

Outliers get separated with fewer cuts, while normal points take more work to isolate.

This makes Isolation Forest fast and efficient, especially with large datasets.

It’s also unsupervised, meaning you don’t need labeled data to make it work.

This makes it perfect when you’re dealing with unknown or messy data.

Another bonus? It works well with high-dimensional data, something that can trip up other outlier detection methods.

Isolation Forest stands out because it turns the problem upside down.

Instead of looking for similarities, it’s looking for differences—specifically, how quickly a point can be separated from the rest of the data.


How Isolation Forest Works


Now, let’s break down how Isolation Forest actually works.

Don’t worry—it’s simpler than it sounds once you get the hang of it.

First, the algorithm randomly selects a small subset of the data.

Then, it builds a decision tree by randomly choosing a feature and splitting the data based on a random value for that feature.

This splitting process continues until each data point is isolated—meaning it’s the only point in a subset.

What makes this algorithm special is how fast it isolates outliers.

Since outliers are “different” and often “far” from the majority of data, they tend to get isolated quickly, meaning they require fewer splits to be on their own.

Normal points, on the other hand, take more splits to get isolated, as they are closer to other data points.

The result of this process is an isolation score.

Points with shorter paths (isolated more easily) are likely to be outliers, while points with longer paths are considered normal.

Let’s say you have a dataset of transactions.

If the algorithm isolates certain transactions very quickly, they’re likely to be fraudulent, because they stand out from the rest.

On the other hand, regular transactions require more effort to separate from one another.


Why Use Isolation Forest?


By now, you might be wondering, “Why should I use Isolation Forest when there are so many other methods out there?”

Well, let’s look at what makes this algorithm stand out.

  • It’s Unsupervised: You don’t need labeled data to use it.
    That’s a huge advantage when you don’t know which data points are outliers in advance, which is often the case.
  • Works with Big, Messy Data: Isolation Forest scales well to large datasets and doesn’t require the clean, well-behaved data that some other algorithms might.
  • High-Dimensional Data? No Problem: Unlike distance-based methods, Isolation Forest doesn’t struggle when you have tons of features (dimensions).
    It handles complex datasets with ease.
  • No Assumptions About Data Distribution: Many other methods assume that your data follows a specific distribution (like normal distribution).
    Isolation Forest doesn’t care about that, so it’s more flexible for real-world data.


This algorithm is used in a lot of cool applications, like fraud detection, cybersecurity, and even spotting defects in manufacturing.

Anytime you need to find things that don’t fit the usual pattern, Isolation Forest can help.


Parameters and Tuning in Isolation Forest


Like any machine learning algorithm, Isolation Forest comes with some knobs and dials you can adjust to make it work better for your specific dataset.

Let’s take a look at the most important parameters and how they affect the results:

  • n_estimators: This is the number of trees the algorithm builds. More trees generally improve performance, but they also take more time to compute. You usually don’t need to go overboard here—100 trees is often a good starting point.
  • max_samples: This parameter controls how many data points each tree will see. If you set it to a lower number, the algorithm works faster, but might miss some patterns. If you set it too high, it might slow things down. A good rule of thumb is to set this to a fraction of your total dataset size.
  • contamination: This tells the algorithm what percentage of the data you expect to be outliers. If you know, for example, that only about 1% of your transactions are fraudulent, you can set this to 0.01. If you’re not sure, you might need to experiment or use cross-validation to find the best value.
  • max_features: This is the number of features used to split each node. You can think of it like narrowing down the possible ways to split the data, which can speed things up but might also miss some subtleties in the data.

Tuning these parameters takes a bit of experimentation, but with some tweaking, you can get Isolation Forest working well for your specific use case.


Practical Example with Python


Let’s get hands-on with some code.

The good news is, Isolation Forest is really easy to implement using Python and libraries like Scikit-learn.

Here’s a simple example to get you started:

from sklearn.ensemble import IsolationForest
import numpy as np
import pandas as pd

# Generating a simple dataset with normal and outlier points
rng = np.random.RandomState(42)
X = 0.3 * rng.randn(100, 2)
X = np.r_[X + 2, X - 2]  # Adding outliers

# Fitting the Isolation Forest model
clf = IsolationForest(contamination=0.1)
clf.fit(X)

# Predicting outliers (-1) and normal points (1)
y_pred = clf.predict(X)

# Visualizing the results
outliers = X[y_pred == -1]
normal_points = X[y_pred == 1]

import matplotlib.pyplot as plt
plt.scatter(normal_points[:, 0], normal_points[:, 1], label="Normal")
plt.scatter(outliers[:, 0], outliers[:, 1], label="Outliers", color='r')
plt.legend()
plt.show()


This code generates a simple dataset, fits an Isolation Forest model, and predicts which points are outliers.

The result is a visualization where normal points and outliers are clearly separated.

Here’s the output separating the Outliers from the rest of the data:
Feel free to play around with different values for contamination or the number of trees (n_estimators) to see how it affects the results.

By the way, if you want to explore the  IsolationForest function in detail, here you go!

IsolationForest Function: A Closer Look

The IsolationForest function in Python is part of the ensemble module from Scikit-learn.

It provides various parameters that allow you to customize how the algorithm works for your specific dataset.

Below is the complete syntax of the IsolationForest function, followed by a breakdown of each part and possible variations.

from sklearn.ensemble import IsolationForest

clf = IsolationForest(n_estimators=100, max_samples='auto', contamination='auto', 
                      max_features=1.0, bootstrap=False, n_jobs=None, 
                      random_state=None, verbose=0)

1. n_estimators

  • Default: 100
  • Description: This parameter controls the number of trees (or “estimators”) that the algorithm will create.
    More trees can improve performance by capturing more detailed patterns but also increase computation time.
  • Possible Values:
    • 100 (default): Good for most datasets.
    • Higher values (e.g., 200, 500): Use more trees if you need a more accurate detection, especially in large datasets. Keep in mind this will increase training time.
    • Lower values (e.g., 50): For faster computation but possibly less precision in detecting outliers.
  • Tip: A good rule of thumb is to start with 100 and increase if needed, based on your dataset’s complexity and size.

2. max_samples

  • Default: 'auto'
  • Description: Defines how many samples (data points) to draw from the dataset for building each tree.
    This helps control the randomness and generalization ability of the model.
  • Possible Values:
    • ‘auto’: Uses the smaller of 256 or the total number of samples.
      This is often a good balance between performance and speed.
    • Float (between 0.0 and 1.0): If you want to specify a fraction of the dataset.
      For example, 0.8 means each tree will use 80% of the data points.
    • Integer: You can specify the exact number of samples.
      For instance, setting max_samples=100 will use exactly 100 samples for each tree.
  • Tip: For small datasets, use 'auto'.
    For larger datasets, using a fraction of the dataset (e.g., 0.7 or 0.8) speeds up the algorithm without sacrificing accuracy.

3. contamination

  • Default: 'auto' in Scikit-learn version 0.24 or later.
  • Description: This parameter tells the model how many outliers you expect in the data.
    The algorithm will treat this percentage of the dataset as outliers.
  • Possible Values:
    • ‘auto’: Automatically estimates the proportion of outliers.
      This is useful if you don’t have a good idea of how many outliers exist, though it might not always be perfectly accurate.
    • Float (between 0.0 and 0.5): If you know (or have a rough estimate) of the contamination rate, specify it.
      For example, if you expect 5% of your data to be outliers, set contamination=0.05.
  • Tip: If you’re unsure, start with 'auto'.
    If your dataset is known to have a specific proportion of outliers, set the exact value (like 0.01 for 1%).

4. max_features

  • Default: 1.0
  • Description: This controls how many features to consider when looking for the best split at each node in the tree.
  • Possible Values:
    • 1.0: Use all the features (default). For most cases, this is appropriate.
    • Float (between 0.0 and 1.0): If you want to randomly select a fraction of features for splitting.
      For example, max_features=0.8 will consider 80% of the features for each split.
    • Integer: The exact number of features to use.
      For example, max_features=2 will select 2 features for every tree split.
  • Tip: In high-dimensional data, using a smaller value (like 0.7 or 0.8) can speed up the algorithm without much loss in performance.
    However, for most datasets, using all features (1.0) is a good choice.

5. bootstrap

  • Default: False
  • Description: This parameter controls whether or not to bootstrap the samples.
    Bootstrapping means sampling with replacement, where some data points could be used multiple times.
  • Possible Values:
    • False: Don’t bootstrap (default).
      Each tree will use a different subset of the data.
    • True: Bootstrap the samples.
      If set to True, some points may be sampled multiple times.
  • Tip: You can set bootstrap=True to add an extra layer of randomness, which might improve generalization in some cases.
    However, it’s not always necessary.

6. n_jobs

  • Default: None
  • Description: This parameter controls how many processor cores to use for parallel processing.
    It can significantly reduce computation time for large datasets.
  • Possible Values:
    • None: Uses only one core.
    • Integer (e.g., 2, 4, -1): Specifies the number of cores. Setting n_jobs=-1 will use all available cores on your machine.
  • Tip: If you have a multi-core processor and a large dataset, setting n_jobs=-1 can make the algorithm run much faster.

7. random_state

  • Default: None
  • Description: Controls the random number generator used for generating random samples and splits.
    It helps ensure reproducibility of your results.
  • Possible Values:
    • None: The algorithm uses the current state of the random number generator, meaning that the results might vary with each run.
    • Integer (e.g., 42): Fixes the randomness.
      If you set random_state=42, the results will be the same every time you run the algorithm.
  • Tip: Set a random_state value if you need consistent results across multiple runs, especially for debugging or benchmarking.

8. verbose

  • Default: 0
  • Description: Controls how much information the algorithm prints during execution.
  • Possible Values:
    • 0: No messages are printed (default).
    • 1 or higher: The higher the value, the more details you’ll see about the progress of the model during training.
  • Tip: If you’re running a large job and want updates on its progress, setting verbose=1 can help track what’s happening.

Putting It All Together: An Example


Here’s an example where we use different variations of the IsolationForest parameters:

from sklearn.ensemble import IsolationForest
import numpy as np
import pandas as pd

# Generating a synthetic dataset
rng = np.random.RandomState(42)
X = 0.3 * rng.randn(100, 2)
X = np.r_[X + 2, X - 2]  # Adding outliers

# Setting up the Isolation Forest with custom parameters
clf = IsolationForest(n_estimators=150, 
                      max_samples=0.8, 
                      contamination=0.05, 
                      max_features=0.75, 
                      bootstrap=True, 
                      n_jobs=-1, 
                      random_state=42, 
                      verbose=1)

# Fitting the model
clf.fit(X)

# Predicting outliers
y_pred = clf.predict(X)

# Checking which points are outliers (-1 means outlier, 1 means normal)
outliers = X[y_pred == -1]
normal_points = X[y_pred == 1]

# Visualizing the results
import matplotlib.pyplot as plt
plt.scatter(normal_points[:, 0], normal_points[:, 1], label="Normal")
plt.scatter(outliers[:, 0], outliers[:, 1], label="Outliers", color='r')
plt.legend()
plt.show()

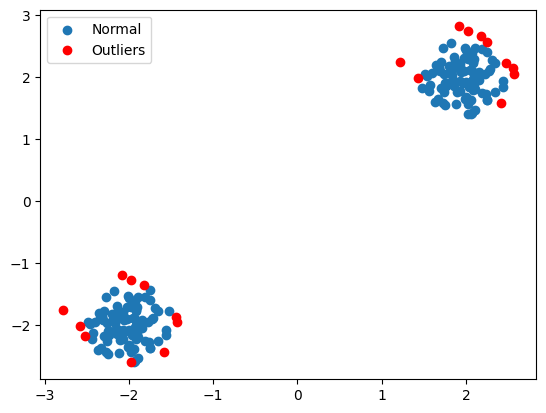
Here’s the output of the above refined code:

Explanation of Custom Parameters in the Example:

  • n_estimators=150: We’re using 150 trees to get a more precise result, at the cost of extra computation time.
  • max_samples=0.8: Each tree will be trained on 80% of the dataset, adding variability and speeding up the process.
  • contamination=0.05: We expect around 5% of the dataset to be outliers.
  • max_features=0.75: The algorithm will consider 75% of the features when splitting nodes, to reduce overfitting in a high-dimensional dataset.
  • bootstrap=True: We enable bootstrapping, which allows more randomness in the trees.
  • n_jobs=-1: We’re using all available processor cores to speed up the computation.
  • random_state=42: This ensures we get consistent results every time we run the code.
  • verbose=1: This prints progress updates as the model trains, helpful for monitoring large datasets.


These variations allow you to fine-tune the performance and efficiency of the Isolation Forest algorithm for your specific dataset and use case.

Adjust these parameters as needed, depending on your data size, dimensionality, and computational resources.


Limitations and Challenges of Isolation Forest


While Isolation Forest is awesome in many ways, it’s not perfect.

Here are a few things to keep in mind:

  • Sensitive to contamination parameter: If you don’t have a good idea of how many outliers to expect, you might need to spend some time tuning this.
  • Struggles with complex patterns: Isolation Forest can have trouble when there are complicated relationships in the data that aren’t easy to capture with random splits.
  • Computational cost: If your dataset is extremely large, training the algorithm can get computationally expensive, especially if you need many trees or large sample sizes.

Despite these challenges, Isolation Forest is still a great option for many outlier detection tasks, especially when you need a method that’s flexible and scalable.


Conclusion


Isolation Forest offers a powerful, flexible, and efficient way to detect outliers in both large and high-dimensional datasets.

Its unique approach—focusing on how easily a data point can be isolated—makes it stand out from traditional methods.

Whether you’re working on fraud detection, cybersecurity, or any task involving anomalies, this algorithm is a strong tool to have in your machine learning toolbox.

With a little practice and parameter tuning, you’ll be able to apply Isolation Forest to your own projects, helping you catch those sneaky outliers before they cause any problems.


References:


In case you are curious to know more about the Isolation Forest Algorithm, here are a few references that might interest you.


  1. Isolation Forest: Efficient Anomaly Detection (Cite: Liu, F.T., Ting, K.M., & Zhou, Z.-H. (2008). Isolation Forest. IEEE International Conference on Data Mining (pp. 413-422))
  2. Isolation-Based Anomaly Detection (Cite: Liu, F.T., Ting, K.M., & Zhou, Z.-H. (2012). Isolation-based Anomaly Detection. ACM Transactions on Knowledge Discovery from Data, 6(1), Article 3)
  3. Outlier Detection : A Survey (Cite: Chandola, V., Banerjee, A., & Kumar, V. (2009). Anomaly Detection: A Survey. ACM Computing Surveys, 41(3), Article 15)
  4. Unsupervised Anomaly Detection with Generative Adversarial Networks to Guide Marker Discovery (Cite: Schlegl, T., Seeböck, P., Waldstein, S.M., Schmidt-Erfurth, U., Langs, G. (2017). Unsupervised Anomaly Detection with Generative Adversarial Networks to Guide Marker Discovery. In: Niethammer, M., et al. Information Processing in Medical Imaging. IPMI 2017. Lecture Notes in Computer Science(), vol 10265. Springer, Cham. https://doi.org/10.1007/978-3-319-59050-9_12)